How Much Data Does TradingView Use? | AirCarta Connectivity Guide
Data Usage · · 7 min read · By AirCarta Team
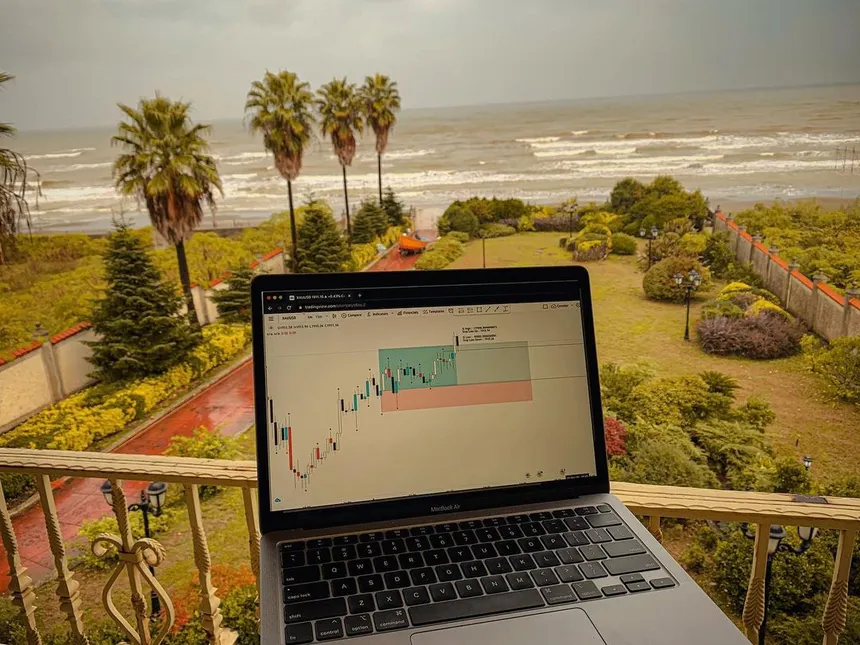 TradingView has become the essential tool for millions of traders and investors, from day traders scalping the NASDAQ open to digital nomads swinging XAUUSD from a café in Bali.
But does its rich charting interface drain your data plan? Does trading volatile futures consume more bandwidth than slow-moving stocks?
TradingView has become the essential tool for millions of traders and investors, from day traders scalping the NASDAQ open to digital nomads swinging XAUUSD from a café in Bali.
But does its rich charting interface drain your data plan? Does trading volatile futures consume more bandwidth than slow-moving stocks?
This guide breaks down TradingView’s data usage by asset class (Forex, Indices, Stocks), shows how to optimize your setup, and explains how to stay connected anywhere using an AirCarta eSIM.
📊 TradingView Data Usage by Activity
TradingView is generally efficient, transmitting lightweight text-based data (price, volume, time). However, usage scales significantly based on tick volume. Markets that move faster send more data updates per second.Here’s a breakdown of general usage:
| Trading Style | Setup Description | Approx. Data per Hour | Approx. Data per 8-Hour Session |
|---|---|---|---|
| Light Monitoring | 1 Chart, H1/H4 timeframes | ~5–10 MB | ~40–80 MB |
| Active Day Trading | 2–4 Chart split layout | ~20–50 MB | ~160–400 MB |
| Heavy Scalping | 4–8 Charts, M1/Sec timeframes | ~80 MB+ | ~640 MB+ |
💹 Asset Classes: Why NASDAQ Uses More Data Than Forex
Not all charts are created equal. The specific instrument you trade has a massive impact on your data consumption.Data usage is driven by "ticks" (price updates). A quiet stock might update once every few seconds, while a volatile index updates dozens of times per second.
1. Indices & Futures (NASDAQ, Dow Jones, CME Data)
If you subscribe to real-time CME Group data to trade futures like NASDAQ (NQ) or Dow Jones (YM), you are receiving a high-density data stream.2. Forex & Metals (XAUUSD, USDJPY)
Forex pairs like USDJPY and commodities like Gold (XAUUSD) are decentralized but highly liquid.3. Comparison by Ticker
| Asset Class | Popular Tickers | Tick Density | Data Consumption Risk |
|---|---|---|---|
| US Indices | NASDAQ (NDQ), Dow (US30), S&P 500 (SPX) | Very High (Extreme at Open) | 🔴 High |
| Metals | Gold (XAUUSD), Silver (XAGUSD) | High | 🟠 Medium-High |
| Forex Majors | EURUSD, USDJPY, GBPUSD | Medium | 🟡 Medium |
| Blue Chip Stocks | Apple (AAPL), Coca-Cola (KO) | Low (Steady) | 🟢 Low |
🔋 How to Reduce Data Usage on TradingView
Whether you’re trading the NFP news release on XAUUSD or the market open on US30, you need to ensure your data lasts.💡 Pro Tip: Combine these settings with an AirCarta eSIM for stable 4G/5G data in over 190 countries. Execute orders instantly on volatile assets like Gold or Bitcoin without fear of lag.
Trading and Travel: Stay Connected Anywhere
TradingView works globally, but accessing it with traditional SIM cards can trigger massive roaming charges. With an AirCarta eSIM for the USA (or your destination), you can access high-speed data worldwide and trade at local rates:💡 Example: A 5 GB AirCarta Plan allows for over 100 hours of active trading on a standard laptop setup, plenty for a full month of travel.
🌐 Why Use AirCarta eSIM for Trading
If you rely on TradingView, MetaTrader (MT4/5), or cTrader while traveling, an eSIM is your best ally. With AirCarta eSIM, you get:📈 Whether you’re in London, Tokyo, or New York, keep your charts live and your execution fast, powered by AirCarta eSIM.
🧭 Final Takeaway
TradingView’s data use ranges from 5 MB/hour for quiet stocks to 50 MB/hour+ for volatile assets like NASDAQ or Gold. For most digital nomad traders, expect around 3 GB per month for a dedicated trading connection.Save mobile data by using single-chart layouts during high volatility, closing background tabs, and using an AirCarta eSIM for secure, global coverage without roaming fees.
Stay connected, trade smarter, and never miss a setup anywhere in the world. 💹
Keywords: TradingView data usage, NASDAQ data usage, XAUUSD data consumption, trading on hotspot, digital nomad trading, AirCarta eSIM, international SIM, mobile trading data, reduce TradingView data, CME data usage.